Thursday, May 17, 2007
Deja Vu
Please bear with me here. Replace the following terms in your head as you read along:
1593 = 2001
Holand = US
tulip bulbs = houses
months = years
Try following the links as they provide additional context. Ready?
"The seeds of this craze were planted in 1593. A man by the name of Conrad Guestner imported the first tulip bulb into Holland from Constantinople, in present day Turkey. After a few years, tulip bulbs became a status symbol and a novelty for the rich and famous. Eventually, tulip bulbs became a hot ticket item in neighboring Germany, as well.
After some time, a few tulip bulbs contracted a non-harmful plant virus called mosaic. The effects of this mosaic virus were tulip petals with beautiful “flames” of color. This unique effect furthermore increased the value of the already rare and highly exclusive tulip bulb.
Initially, only the true connoisseurs bought tulip bulbs, but the rapidly rising price quickly attracted speculators looking to profit. It didn’t take long before the tulip bulbs were traded on local market exchanges, which were not unlike today’s stock exchanges.
By 1634, tulip mania had feverishly spread to the Dutch middle class. Pretty soon everybody was dealing in tulip bulbs, looking to make a quick fortune. The majority of the tulip bulb buyers had no intentions of even planting these bulbs! The name of the game was to buy low and sell high, just like in any other market.
In 1636, tulips were trading hands on the Amsterdam stock exchange as well as on exchanges in Rotterdam, Harlem, Levytown, Horne, and many other exchanges in other nearby European countries.
These exchanges started to offer option contracts to speculators. These option contracts allowed tulip bulbs to be speculated upon for a fraction of the price of a real tulip bulb. This allowed people of lower means to speculate in the tulip market. Additionally, options allowed for leverage. Due to leverage, option buyers were able to control larger amounts of tulip bulbs, allowing a greater profit.
Unfortunately, leverage is a double-edged sword. If the tulip bulb price moved downwards ever so slightly, the option buyer’s investment would be lost and they might even owe money! Talk about risky.
But at this point, it was commonly believed that the tulip market was immune to crashing and that it would “always go up”.
After some time, the Dutch government started to develop regulation to help control the tulip craze. It was at this point that a few informed speculators started liquidating their tulips bulbs and contracts. It was these people, or the smart money, that secured large profits that were now in the form of cold hard cash.
In addition, more tulip bulbs were added to the supply due to people harvesting new tulip bulbs. Suddenly tulip bulbs weren’t as quite as rare as before. The tulip market began a slight down trend, but shortly after started to plummet much faster than prices went up. Suddenly the market began a widespread panic when everyone started realizing that tulips were not worth the prices people were paying for them. In less than 6 weeks, tulip prices crashed by over 90%.
Fortunes were lost. Wealthy became paupers. Bankruptcies were everywhere due to the negative side of option leverage. People that traded in farms and live savings for a tulip bulb were left holding a worthless plant seed. Many defaults occurred, where speculators couldn’t pay off their debts.
The Dutch government avoided intervening, only to advise tulip speculators and owners to form a council to attempt to stabilize prices and mend public confidence. Every one of these plans failed miserably, as tulip prices plummeted even lower than before.
The financial devastation that followed the tulip bulb crash lasted for decades, crippling Dutch commerce. The price of tulips at the height of the mania was $76,000; 6 weeks later they were valued at less than one dollar! The only people who prospered from the insanity were the smart money who liquidated at the top."
Monday, May 14, 2007
Liquidity boom and looming crisis
Liquidity boom and looming crisis
By Henry C K Liu
Economic growth in the US slowed to 1.3% in the first quarter (Q1) of 2007, the worst performance in four years of an overextended debt bubble. Yet the Dow Jones Industrial Average (DJIA) rose to an all-time intra-day high of 13,284.53 to close at 13,264.62 last Friday, rising more than 1,000 points or 9% in the same period.
The DJIA is now 82% higher than its low of 7,286.27 on October 9, 2002, during which US gross domestic product (GDP) grew only 38%.
The 10-year cycle of financial crises
The historical pattern of a 10-year rhythm of cyclical financial crises looms as a menacing storm cloud over the financial markets.
The 30% US market crash of 1987, in which investors lost 10% of 1987 GDP, was set off by the 1985 Plaza Accord to push down the Japanese yen with an aim of reducing the growing US trade deficit with Japan. The 1987 crash was followed 10 years later by the Asian financial crisis of July 2, 1997, with all Asian economies going broke, and some stock markets such as Thailand's losing 75% of their value, and Hong Kong having to raise its overnight deposit rate to 500%, trying to defend the fixed exchange rates of their currencies.
In South Korea, Daewoo Motors, facing bankruptcy, was forced to be taken over on the cheap by General Motors. In Indonesia, the Suharto government fell because of social instability arising from the financial crisis. A wave of deflation spread over all of Asia from which Japan, already in recession since 1987, has yet to fully recover two decades later. In the United States, the DJIA dropped 7.2% on October 27, 1997, and the New York Stock Exchange had to suspend trading briefly to break the free fall.
Now in 2007, a looming debt-driven financial crisis threatens to put an end to the decade-long liquidity boom that has been generated by the circular flow of trade deficits back into capital-account surpluses through the conduit of US dollar hegemony.
While the specific details of these recurring financial crises are not congruent, the fundamental causality is similar. Highly leveraged short-term borrowing of low-interest currencies was used to finance high-return long-term investments in high-interest currencies through "carry trade" and currency arbitrage, with projected future cash flow booked as current profit to push up share prices.
In all these cases, a point was reached where the scale tipped to reverse the irrational rise in asset prices beyond market fundamentals. Market analysts call such reversals "paradigm shifts". One such shift was a steady fall in the exchange value of the US dollar, the main reserve currency in international trade and finance, to cause a sudden market meltdown that quickly spread across national borders through contagion with selling in strong markets to try to save hopeless positions in distressed markets.
There are ominous signs that such a point is now again imminent, in fact overdue, in globalized markets around the world.
Weak economic data
US GDP growth of 1.3% for Q1 2007 announced by the Commerce Department on April 27 was weaker by almost half than the 2.5% growth rate logged in the fourth quarter (Q4) of 2006. The main culprit was a housing slump caused by a meltdown in the subprime mortgage sector.
US home-building dropped by 17% on an annualized basis and is expected to worsen. That happened after investment in home-building was slashed at an even deeper 19.8% pace in Q4 2006. There are no signs that the housing slump has hit bottom, or that its adverse impact on the economy and the financial market has been fully felt globally.
Deprived of expanding wealth effect by falling home prices, US consumer spending was up only 0.3% in April on a 0.7% rise in personal income, while core inflation was muted. Consensus estimates had been for a 0.5% rise in spending on a 0.6% gain in income. Adjusted for inflation, consumer spending was actually 0.2% lower month on month, its biggest drop since September 2005, suggesting that without additional cash-out refinancing on rising home values, high energy prices might have finally dampened consumer willingness and ability to spend on non-energy purchases.
GDP measures the value of all goods and services produced in a domestic economy. It is considered by economists and policymakers to be the best overall barometer of economic health. US economic performance in Q1 2007 was weaker by 0.5 percentage point than even the forecast low expectation of 1.8%.
US Federal Reserve chairman Ben Bernanke and Treasury Secretary Henry Paulson both made obligatorily optimistic statements denying the likelihood of a recession this year, even though former Fed chief Alan Greenspan has openly put the odds at one in three.
Even though the US economy slowed in Q1 2007, inflation pressure continues to complicate Fed policy deliberation. Core prices, excluding food and energy, rose at a rate of 2.2% in Q1 2007, up from a 1.8% pace in Q4 2006. Overall prices jumped by 3.4% in Q1 2007, compared with a 1.0% decline on an annualized basis in Q4 2006.
The Fed's dilemma
While Federal Reserve policymakers traditionally view inflation as the main danger to the economy, they optimistically predict that inflation will moderate as the US central bank stays with a tight monetary policy.
Since last June 29, the Federal Reserve has not moved the Fed Funds Rate target, the interest rate at which depository institutions lend balances to each other overnight. Before that, it had lifted rates 17 times at a "measured pace" of 25 basis points over a 36-month period, for a total 425 basis points to ward off inflation. The current Fed Funds Rate target is 5.25%, from a low of 1% set on June 25, 2003. Many economists and money-market participants predict that the Fed will continue to leave rates unchanged at its next meeting this Wednesday.
The Fed's stated goal is to cool an overheated economy sufficiently to keep inflation in check by raising short-term interest rates, but not so much as to provoke a recession. Yet in this age of finance and credit derivatives, the Fed's interest-rate policy no longer holds dictatorial command over the supply of liquidity in the economy. Virtual money created by structured finance has reduced all central banks to the status of mere players rather than key conductors of financial markets. The Fed now finds itself in a difficult position of being between a rock and a hard place, facing a liquidity boom that decouples rising equity markets from a slowing underlying economy that can easily turn toward stagflation, with slow growth accompanied by high inflation.
Wealth effect exhausted, dissipated by maldistribution
The wealth effect from rising equity prices has been caused directly by a debt bubble fed by overflowing liquidity created beyond the Fed's control, by the US trade deficit denominated in dollars returning to the US as capital-account surpluses. This debt-driven liquidity boom is exacerbated by a falling dollar, which artificially inflates offshore earnings of transnational corporations to support rising share prices pushed up by too many dollars chasing after a dwindling supply of shares caused by corporate share-buyback programs paid for with low-interest loans.
Further, the wealth effect from the equity bubble has not been broadly distributed, resulting in a boom in the luxury consumer market catering to the beneficiaries of capital gain while the broad consumer market catering to wage earners stalls. The newly rich in the financial sectors are buying multimillion-dollar first and second and even third homes, while average workers are buying cheap T-shirts and shoes made in China. The highest-paid hedge-fund manager took home US$1.7 billion in 2006, while the average US worker's annual pay was $28,000. The minimum wage was $5.15 per hour. If the minimum wage had risen at the same rate as chief executive officers' pay, it would have been $22.61 per hour in 2006.
Wages decline while returns on capital soar
Another troubling bit of economic news came from the US Labor Department, that while the DJIA rose 5.9% in Q1 2007 with inflation at 2.2 %, wages and benefits grew by only 0.8%, down slightly from the low 0.9% increase in Q4 2006. Wages and salaries went up 1.1%, the fastest since 2001, but benefit costs edged up only 0.1%, the slowest since Q1 1999 despite rising medical costs, reflecting a trend by companies to maximize their earnings by abdicating their social responsibilities to their workers and to society.
Labor's share of the US GDP growth of 1.3% amounted to negative-2.6% after a 3.4% inflation adjustment, while capital's share was positive 2.5%. If labor's share of GDP growth were to be kept neutral after inflation, capital's share would register negative-0.1%. This is not good news to anyone except the Fed, which views rising wages as inflation. And if labor's share of GDP growth remains negative, companies will not be able to sell their products and will be forced to lay off workers to maintain profit margins, thus slowing economic growth still further.
Jobless expansion
US consumer spending rose at a 3.8% pace in Q1 2007, slightly weaker than the 4.2% growth rate logged in Q4 2006. This signals the depletion of the wealth effect from asset inflation.
US job creation slowed to its weakest pace in more than two years in April as layoffs extended beyond manufacturing and construction to retail trade. Unemployment rose to 4.5% in April from 4.4% in March, with only 88,000 new jobs created in April, compared with an increase of 177,000 in March.
The slowdown in job creation reflects recent economic weakness but is likely to be viewed perversely by the Federal Reserve as a welcome sign that wage inflation pressures are easing. Heavy job losses in the retail sector were a sign of a "broad-based deceleration" in employment in the service sector, underlining fears about the resilience of consumer spending. The retail sector shed 26,000 workers, while house builders cut 11,000 positions and manufacturers eliminated 19,000.
In April, US private-sector jobs registered the weakest growth in four years, increasing by only 64,000. Service firms added 106,000 jobs, goods producers cut 42,000; small businesses created 45,000 jobs and about 24,000 government jobs were added, adding up to a job growth of 88,000, lower than the 100,000 forecast. Unit labor costs, a much-watched inflation signal, rose at only 0.6% annualized, way below expectations of 2.1%. In the manufacturing sector, while jobs continued to decline, the cost figures were higher: productivity was up 2.7% while unit labor costs grew as well at 2.7%, reflecting growth in high-tech, big-ticket manufacturing such as commercial aircraft where the US still commands global competitiveness.
This jobless recovery is still 6.7 million private-sector jobs short of the typical recovery 67 months after a previous business-cycle peak.
New geometry of debt securitization
The mortgage sector before the age of securitization was shaped like a cylinder in which risk was evenly spread throughout the entire sector, thus all mortgages share the aggregate cost of default. This even spread of risk premium is viewed as market inefficiency.
Securitization through collateralized debt obligations (CDO) permits the unbundling of generalized risk embedded in all debt instruments into tranches of escalating risk levels with compensatory higher returns, and in the process squeezes additional value out of the same mortgage pool by maximizing risk/return efficiency.
The geometry of CDO securitization transforms the cylinder shape of the mortgage sector to a pyramid shape, with the least risky tranches at the top and the more risky tranches with commensurate premiums toward the bottom, so that a greater aggregate risk premium can be squeezed out by the security packagers and investors as profit. This extra value, when siphoned off repeatedly from the overall mortgage pool, requires an ever larger base of subprime mortgages in the new pyramid shape, thus increasing the systemic risk further.
Subprime borrowers are no longer just low-income borrowers. They include high-income borrowers whose incomes and collateral value do not provide sufficient reserve for sudden changes in market conditions. A subprime borrower is one who over-borrows beyond prudent standards. The extra risk-premium value thus taken out of the mortgage sector contributes to the increase in liquidity to feed the debt market further, pushing the low credit standard of subprime lending further down. Once prime-credit customers have borrowed to their full credit limits, growth can only come from lowering credit standards, turning more prime borrowers into subprime borrowers.
This is the structural unsustainability of CDO securitization, irrespective of the state of the economy, since risk of default is shifted from the state of the market to the direction of the market. Any slight turn in market direction will set off a downward-spiral crisis. The initial upward phase of this cycle is euphoric, like any addiction, but the pain will come as surely as the sun will set in the downward phase.
Not many economists or regulators have yet focused on this structural defect of CDO securitization. The recent congressional hearings on subprime mortgages completely missed this obvious structural flaw.
China's foreign reserve mirage
China's latest foreign-reserves data showed that there is as much as $73 billion in unexplained new reserves. The People's Bank of China (PBoC), the central bank, now holds more than $1.2 trillion in foreign reserves, the most among the world's central banks, except the US Federal Reserve, which can create dollars at will and therefore needs not hold any foreign reserves.
The Wall Street Journal explained the Chinese foreign-exchange puzzle by suggesting that the "leading suspect is a possible series of foreign-currency swaps by Chinese banks". The Journal reported that foreign-exchange trading among Chinese banks in 2006 was "more active than widely known".
The PBoC did not provide any comments or an explanation. The question is whether the funds were in fact swaps, which would mean only minor implications for the broader economy, or if they actually were dollar inflows, which could further stimulate an overheated economy.
Dollar inflows would require further monetary tightening by the PBoC, on top of the numerous hikes in interest rates and bank reserve requirements over the past year, to reduce the risks of an equity bubble fueled by expanded money supply. On April 29, China raised the required bank reserve for the fourth time this year, reducing the amount available for bank lending in a new effort to cool an investment boom that could spark a financial crisis. The order by the central bank came on top of successive interest-rate hikes and investment curbs imposed on real estate, auto manufacturing and other industries over the past year.
The effort has had only limited success in slowing the frenzy growth of investment. The amount of reserves that lenders must keep with the central bank was raised 0.5 percentage point to 11% of their deposits, from 7.5% of deposits, before the first increase last June. The increase to 11% from 10.5% will take effect next Tuesday, May 15.
The central bank said, "The increase in bank reserve is aimed at stepping up liquidity management of the banking system and to guide a reasonable growth of credit." The Consumer Price Index rose 3.3% in March, above the Chinese government's 3% target. And fixed-asset investment countrywide grew a robust 23.7% during March. The economy grew 10.7% in 2006, the highest rate since 1995. The central bank said China's international balance-of-payments problem is boosting excessive liquidity in the Chinese economy.
China's phantom trade surplus
Chinese global trade surplus hit a record $177.5 billion in 2006, up 74% from the previous year. Take away $73 billion of capital inflow and $60 billion in returns on foreign capital, and China's net trade surplus was only about $40 billion in 2006. By comparison, Japan's trade surplus was $168 billion and Germany's was $146 billion.
The US trade deficit with China widened to a record $233 billion in 2006, out of a global total of $857 billion. If the US reduces its trade deficit with China, China will reduce its own trade deficit with its other trading partners, without much impact on the US global trade deficit.
Dollar hegemony distorts Chinese economy
The adverse effect of dollar hegemony on the Chinese economy is becoming clearly visible. As the dollar-denominated trade surplus mounts, the PBoC is forced to tighten domestic macro-monetary measures to neutralize the increased yuan money supply resulting from buying up the surplus dollars in the Chinese economy with the local currency. The Chinese trade surplus is causing a monetary bubble in the Chinese economy while real wealth is leaving China in the form of exported goods, causing a rising money supply chasing after a shrinking asset base.
The dollars that the PBoC buys with Chinese yuan go to finance the US debt bubble. The new yuan money, instead of going to finance development of the interior region in China, is attracted by speculative real estate and equities, pushing prices up beyond fundamentals. The Shanghai Stock Exchange Composite (SHCOMP) rose 27% in a month after a 7% drop that spooked world markets in late February, including a 3% drop in the Dow. The Shanghai real-estate bubble keeps growing in a speculative frenzy while rural villages are starving for capital.
China re-exports dollars
Led by China and Japan, all the exporting economies, saddled with dollars that cannot be used in their domestic economies without creating a monetary crisis, are fueling a global liquidity boom focused on the importing economies led by the US, where the dollar is a legal tender that involves no conversion cost. This global liquidity boom denominated in dollars will cause inflation in the dollar economy that will spill over to all other economies.
The US real-property boom has created huge service demands that lead to tight labor markets. The global commodity bubble of the past three years has increased costs of living and production, adding more than 5% to global GDP growth. Although commodity inflation has been absorbed through low-interest consumer borrowings and lower-wage labor in the past, it is now finally showing up as higher-cost factor inputs.
China has kept the global cost of manufacturing artificially low by not paying adequately for pollution control and worker wages and benefits, including inadequate retirement provisions. Domestic political pressure within China is forcing the government to normalize full production cost, which will boost global inflation.
Financial globalization and inflation
Financial globalization has increased the elasticity of macro-trends, causing a delayed effect in inflation. But it has not banished inflation altogether, nor has it eliminated the business cycle. It has merely extended the historical cycle from seven years to beyond 10 years.
Global inflation has picked up by 60 basis points in the past four quarters. If the trend continues, major central banks will have to focus on fighting inflation by cooling the liquidity boom. To avoid a drastic market collapse, anti-inflation measures will need to be implemented at a "measured pace", which means it may take as long as two years to take effect. The problem is that the system, which operates on ever rising asset values, cannot weather a two-year-long anemic growth. Thus even a soft landing will quickly turn into a crash.
Bonds will be the first asset class to decline in market value in this anti-inflation cycle, which will eventually also affect other asset classes. As the flat or inverted yield curve spikes upward back to normal, making the spread between long-term and short-term rates wider, the commodity bubble will burst, followed by the stock market in a general deflation. Such a deflation cannot be cured by the Fed adopting inflation-targeting through printing more dollars because inflation-targeting is merely transmitting price deflation to a monetary devaluation.
Globalization and hedging have merely postponed, not eliminated, cyclical inflation. Globalization has stunted wage inflation as the main transmission between monetary growth and inflation. Hedging only reassigns unit risk to systemic risk. It does not eliminate risk. Instead, excessive liquidity fuels asset appreciation beyond economic fundamentals. To generate demand from the wealth effect, appreciated value must be monetized through debt. As debt rises, systemic risk rises with it. As globalization spreads demand growth around the world, inflation has taken longer than normal to show up in outdated data interpretation.
The burst of the tech bubble, the shock of September 11, 2001, and the manufacturing and outsourcing of information technology caused sharp disinflation in 2002 to neutralize debt-driven dollar inflation. The average dollar inflation in the economies of the Organization for Economic Cooperation and Development (OECD) decelerated from 3.2% in second quarter of 2001 to 1.1% in Q3 2002. The threat of dollar deflation caused the Fed to cut the Fed Funds Rate to 1% on July 9, 2003, and kept it there for 12 months until July 7, 2004, while the Bank of Japan maintained a zero interest rate. This in turn led to a massive liquidity boom that fed an escalating US trade deficit.
Before the emergence of dollar hegemony, through which it became possible to finance the US trade deficit with a US capital-account surplus, then-Fed chairman Paul Volcker had to raise the Fed Funds Rate to an all-time high of 19.75% on December 17, 1980, to curb stagflation caused by a rising trade deficit. Five years later, in 1985, Volcker engineered the Plaza Accord to force the Japanese yen up against the dollar to curb the US trade deficit with Japan, promptly pushed the Japanese economy into sharp deflationary depression from which Japan has not yet fully recovered. Volcker's victory over US inflation was won by forcing deflation on Japan.
Global liquidity boom sourced by dollar supply increase
The fountainhead of the global liquidity boom is in the vast increase of the supply of US dollars, both as a result of Fed monetary policy and of dollar-denominated structured finance under dollar hegemony. This liquidity boom has helped create demand through inflating asset markets.
The wealth effect of property inflation produced both producer and consumer spending power released by debt. Commodity inflation has given producer economies, such as oil states, windfall incomes to invest in the advanced economies. Declining cost of capital fueled a new wave of financial expansion through private-equity and hedge-fund acquisitions financed with high leverage.
What is liquidity and how is a liquidity boom created?
Liquidity is affected by a monetary environment created by central-bank policies and actions.
Lowering interest rates increases liquidity. Easing money-supply measures relative to growth in nominal economic activity also increases liquidity. The level of liquidity in corporate or individual balance sheets relates to cash and credit positions with which to invest or spend. But availability of money alone does not create liquidity, which requires a market in which assets can be bought and sold without regulatory restrictions or causing fundamental shifts in price levels.
The demand for assets relative to their supply also affects liquidity. Market confidence fundamentally affects liquidity, which depends on states of mind of market participants relating to appetite for risk-taking.
Hedge funds contribute significantly to the increase of liquidity by enlarging investor appetite for risk-taking. Collateralized debt obligations and credit derivatives have acted to expand liquidity in the credit markets through disintermediation and innovation. Banks have moved from the traditional "buy and hold" mode to the "originate and distribute" mode, whereby they distribute portfolios of credit risks and assets to other market players through securitization. Banks also act increasingly as suppliers of revolving credit independent of their deposits as they obtain additional credit protection through credit derivatives.
A liquidity boom requires the continuing confluence of all these factors, an even slight change in any of which can have an unraveling effect that puts a sudden end to it. A precipitous fall in the US dollar could trigger market sell-offs, as it did after the Plaza/Louvre Accords of 1985 and 1987, first to push down and later push up the dollar, which contributed to the 1987 crash.
Another cause of the 1987 crash was a threat by the US House of Representatives Ways and Means Committee to eliminate the tax deduction for interest expenses incurred in leveraged buyouts. Still another cause was the 1986 US Tax Act, which while sharply lowering marginal tax rates, nevertheless raised the capital gains tax to 28% from 20% and left capital gains without the protection against inflated gains that indexing would have provided. This caused investors to sell equities to avoid negative net after-tax returns and contributed significantly to the 1987 crash.
The danger of a liquidity bust
Today, any one factor out of a host of interconnected factors, such as new regulation on hedge funds, or sharp changes in the yuan exchange rate against the US dollar, or an imbalance between tradable assets and available credit, etc, could bring the current liquidity boom to a screeching halt and turn it into a liquidity bust.
With finance globalization and the dominance of derivative plays by hedge funds and private-equity firms, any minor disruption could turn into a financial perfect storm that makes the collapse of Long Term Capital Management look like a tempest in a teacup.
William Rhodes, chairman, president and CEO of Citibank North America and of Citicorp Holdings Inc, wholly owned subsidiaries of Citigroup Inc, of which Rhodes is senior vice chairman, wrote in March:
During the last big adjustment that started in July 1997 in Thailand and spread to a number of Asian economies including South Korea, followed by Russia in 1998 - and led ultimately to the bailout of Long Term Capital Management, the US hedge fund - a number of today's large market operators were not yet in the mix. Today, hedge funds, private equity and those involved in credit derivatives play important, and as yet largely untested, roles.
The primary worry of many who make or regulate the market is not inflation or growth or interest rates, but instead the coming adjustment and the possible destabilizing effect these new players could have on the functioning of international markets as liquidity recedes. It is also possible that they could provide relief for markets that face shortages of liquidity. Either way, this clearly is the time to exercise greater prudence in lending and in investing and to resist any temptation to relax standards.
The five-year global growth boom and four-year secular bull market may simple run out of steam, or become oversaturated by too many late-coming imitators entering a very specialized and exotic market of high-risk, high-leverage arbitrage. The liquidity boom has been delivering strong growth through asset inflation (property, credit spreads, commodities, and emerging-market stocks) without adding commensurate substantive expansion of the real economy. Unlike real physical assets, virtual financial mirages that arise out of thin air can evaporate again into thin air without warning. As inflation picks up, the liquidity boom and asset inflation will draw to a close, leaving a hollowed economy devoid of substance.
Massive fund flows from the less experienced non-institutional, retail investors into hot-concept funds such as those focusing on opportunities in BRIC (Brazil, Russia, India and China) or in commodities, or in financial firms involved in currency arbitrage and carry trades, have caused a global financial mania in the past five quarters that has defied gravity. It will all melt away in a catastrophic unwinding some Tuesday morning.
Inflationary pressure in the US and other OECD economies makes a cyclical bear market inevitable and an orderly unwinding unlikely. Central banks cannot ease because of a liquidity trap that prevents banks from being able to find creditworthy borrowers at any interest rate. Banks could be pushing on a credit string and global liquidity could decline, causing asset-risk valuations to contract suddenly and sharply. A liquidity trap can also occur when the economy is stagnant and the nominal interest rate is close or equal to zero, and the central bank is unable to stimulate the economy with traditional monetary tools because people do not expect positive returns on investments, so they hoard cash to preserve capital. Capital then becomes idle assets.
As the decade-long US consumption collapses from exhaustion, a secular bear market arises in which the bullish rebounds are smaller and do not wipe out the losses of the previous bear market. Because Asia's growth has been driven by low-wage exports, it will not be ready fill in as the global growth engine in time to prevent a global crash. China is just beginning to change its development model to boost worker income and household consumption and may take as long as a decade to see the full effects of the new policy. China's only option is to insulate itself from a global meltdown by resisting US pressure to speed up the opening of its financial markets. China's purchasing power is too weak to save the global economy from a deflationary depression.
A global financial crisis is inevitable. So much investment has been sunk into increasing commodity production that a commodity-market bust, while having the effect of a sudden tax cut for the consuming economies, will cause bankruptcies that will wipe out massive amounts of global capital.
A financial crisis could trigger a global economic hard landing. Global financial markets look suspiciously like a pyramid game in this overextended secular bull market. The proliferation of complex derivative products catering to short-term trading strategies that aim to get the biggest bang for the buck creates massive uncertainty surrounding leverage in the global financial system. A commodity burst could cause correlation trades to unwind in other markets, which could snowball quickly into a massive financial crisis.
When markets are hot, fund-manager companies tend to market funds aggressively, especially ones with hot concepts. Commodities, BRIC, etc, have been the hot concepts in this cycle. Tens of billions of dollars have been raised by such funds from the less experienced retail investors over the past three quarters in Japan, South Korea, Taiwan, Hong Kong, etc. This source of money has fueled rapid price appreciation in the recipient markets.
Starved of good returns in the US, long-term investors have been allocating funds to emerging-market and commodity specialists to chase the good performance. Such funds have flowed disproportionately into small and illiquid stocks, causing them to rise in rapid multiples. Their good performance attracts more funds and reinforces the virtuous cycle.
Rising leverage is another technical factor that has artificially boosted liquidity in the hot markets. Derivative products such as warrants are a major factor. Some funds leverage up to increase exposure to high-beta assets. Beta is a coefficient measuring a stock's relative volatility, a covariance of a stock in relation to the rest of the stock market. Capital preservation strategies prefer low-beta stocks. High-beta assets offer high returns for taking high risks.
Before finance globalization, if short-term dollar interest rates were higher than longer-term interest rates, a condition reflected by an inverted yield curve, US Treasury bond prices could not be boosted by carry trades between currencies. Today, borrowing short-term low-interest currency to invest in longer-term debt in high-interest currencies, thus earning the "carry", or interest rate spread, between the two types of debt denominated in separate currencies is routine. If short-term rates in the US are prohibitively high, or higher than long-term rates, then carry-traders can simply do most of their borrowing overseas in a foreign currency. Furthermore, if the 4% spread between short-term Japanese interest rates and US T-bond yields is not sufficiently rewarding, the return can be boosted to 40% using routine 10:1 leverage.
More lucrative still, borrow in Japanese yen to invest in Brazilian or Turkish bonds, using various derivatives to hedge currency or credit risk and pass it on to counter-parties at the cost of a relatively small insurance premium. The supply of "hot money", money that can be shifted around rapidly in response to changes in expected returns, now seems to be endless, because if monetary conditions start to get tighter in one part of the world, then the speculators can always find a source of low-cost financing somewhere else. And the Bank of Japan (BOJ), later joined by the Federal Reserve, with their zero, near-zero, or at least below-neutral interest rates, in effect underwrite the whole process.
The financial markets experienced minor shocks recently when the BOJ soaked up a lot of liquidity and hinted at the need to commence a rate-hike program. The minor shocks in fact forced the BOJ to back away from its planned monetary tightening to keep the speculative frenzy going. This is the reason the inversion of the US yield curve, which normally mean liquidity is about to contract, has not yet triggered a liquidity recession. A liquidity boom will continue as long as a major central bank with large foreign reserves, such as the BOJ, continues to price short-term credit at bargain-basement levels and leaves its borrowing window open to all comers.
The People's Bank of China also contributes to the global liquidity boom by its willingness to continue to buy long-term US T-bonds even if rates fall.
The US current-account deficit is the key driver of the liquidity boom. Those who clamor for a reduction of the US trade deficit are unwittingly calling for a US recession.
When the ongoing meltdown in the subprime mortgage market spreads to other parts of the credit markets, the Federal Reserve will be forced to implement a monetary ease. But a liquidity trap will activate the dynamics of an inverted yield curve, with long-term rates falling faster than the Fed Funds Rate. When demand for bank reserves decreases because of a general slump in loan demand, then the Fed has to destroy bank reserves to prevent a collapse of Fed Funds Rate to zero.
Doomsday machine
A liquidity trap can be a serious problem because the world is still plagued with excess liquidity potential: massive foreign reserves held by central banks, bulging petrodollars, hedge funds and private-equity funds, massive increases in global monetary base, $4 trillion in low-yielding Chinese bank deposits ready for release for higher yields, $5 trillion in low-yielding US time deposits maturing, $10 trillion in low-yielding Japanese financial net worth, plus $27 trillion in medium-yielding US household financial net worth waiting to be monetized for aggressive yields. A global liquidity trap of with $50 trillion of idle assets will implode like a doomsday machine.
An US dollar exchange rate is a measure of the relative value of a foreign currency against the dollar, not the intrinsic value of the dollar. When the euro rises against the dollar, it is possible that both currencies have fallen in purchasing power, but the euro has merely fallen less than the dollar. This is what drives the liquidity boom that has been decoupled from the real economy.
Henry C K Liu is chairman of a New York-based private investment group. His website is at www.henryckliu.com.
(Copyright 2007 Asia Times Online Ltd. All rights reserved. Please contact us about sales, syndication and republishing.)
Sunday, May 13, 2007
Getting there...
I admit the numbers below are from our neighbors down the hill...
In my opinion, these are the same numbers (-30-40%) we will see in the coming months.
My crystal ball is blurry at the time, but it looks like 48-72 months...
What happens when Amgen takes a hit from the anemia scandals?
Do you think Countrywide will be relocating employees to HQ any time soon?
Hold on for the ride guys...
Thursday, May 3, 2007
A look at the future
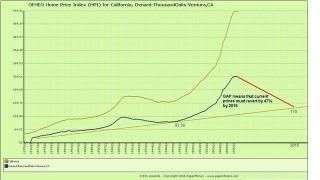
This forecast is based on the simple fact that every bubble pops. Every housing bubble in history has popped, and prices in those booms on record have fallen 35-40%. But we know this boom dwarfed the others.
In the end, prices must revert to a multiple of 10 - 12x rents, or 3x the income of the buyer. We are many times above that.
Thanks to paperdinero for the chart. You can get the chart for any state, county, or MSA on that site. Just click on your choice, and there is your chart, which starts in 1975.
Sunday, April 29, 2007
March Sales
The numbers are in and compared to last year:
SFH sales are down 32%
Median price for SFH 4BR+ is down 8%.
Number of listings is up 60%
Oouch!
Stay tuned. This is just starting.
March sales of Conejo Valley single-family homes totaled 106. This compares to 93 sold in February and 156 a year ago, according to Allen Reznick President, Conejo Valley Association of REALTORS.
Median sales price for single- family homes in March 2007 was $814,285; in 2006 it was $842,105. The median price is the point where half of the units sold for more and half for less.
Median prices for single- family homes in March were as follows: $625,000 for 1 two bedroom homes, 664,473 for 25 three-bedroom homes; and $883,333 for 80 four or more bedroom homes. This compares to sales in March 2006 of $583,222 for 4 homes up to two bedrooms; $671,874 for 44 three-bedroom homes; and $959,677 for 108 four or more bedroom homes.
Condominium sales totaled 66 in March compared to 36 in February 2007 and 74 for March 2006.
Total Sales for all real estate transactions in March were $147,223,550 for March 2006 the total was $220,418,498.
New residential listings totaled 480 in March 2007 compared to 303 in March 2006 and 129 in February 2007.
Monday, April 23, 2007
Real Estate Crash a Post Mortem for the Stock Market
The real estate market is crashing faster than anyone had anticipated. Housing prices have fallen in 17 of 20 of the nation's largest cities and the trend lines indicate that the worst is yet to come. March sales of new homes plummeted by a record 23.5% (year over year) removing all hope for a quick rebound. Problems in the subprime and Alt-A loans are mushrooming in previously “hot markets” resulting in an unprecedented number of foreclosures.
The defaults have slowed demand for new homes and increased the glut of houses already on the market. This is putting additional downward pressure on prices and profits. More and more builders are struggling just to keep their heads above water. This isn't your typical 1980s-type “correction”; it's a full-blown real estate cyclone smashing everything in its path.
Tremors from the real estate earthquake won't be limited to housing—they will rumble through all areas of the economy including the stock market, financial sector and currency trading. There is simply no way to minimize the effects of a bursting $4.5 trillion equity bubble.
The next shoe to drop will be the stock market which is still flying-high from increases in the money supply. The Federal Reserve has printed up enough fiat-cash to keep overpriced equities jumping for joy for a few months longer. But it won't last. Wall Street's credit bubble is even bigger than the housing bubble — a monstrous, lumbering dirigible that's headed for a crash-landing. The Dow is like a drunk atop a 13,000 ft cliff; inebriated on the Fed's cheap “low-interest” liquor. One wrong step and he'll plunge headlong into the ether.
The stock market cheerleaders are ooooing and ahhing the Dow's climb to 13,000, but it's all a sham. Wall Street is just enjoying the last wisps of Greenspan's low interest helium swirling into the largest credit bubble in history. But there are big changes on the way. In fact, the storm clouds have already formed over the housing market. The subprime albatross has lashed itself to everything in the economy — dragging down consumer confidence, GDP and (eventually) the stock market, too. The real damage is just beginning to materialize.
So why the stock market keep hitting new highs?
Is it because foreign investors believe that American equities will continue to do well even though the housing market is slumping and GDP has shriveled to the size of a California raisin? Or is it because stockholders haven't noticed that the greenback is getting clobbered every day in the currency markets? Or, maybe, investors are just expressing their confidence in the way the U.S. is managing the global economic system?
Is that it - they admire the wisdom of borrowing $2.5 billion per day from foreign lenders just to keep the ship of state from taking on water?
No, that's not it. The reason the stock market is flying-high is because the Federal Reserve has been ginning up the money supply to avoid a Chernobyl-type meltdown. All that new funny-money has to go somewhere, so a lot of it winds up in the stock market. Evergreen Bank's Chuck Butler explains the process in Thursday's Daily Pfennig:
“The Fed may have quit publishing the M3 data, but they continue to publish all the data that goes into the calculation and our friends over at Shadow Government Statistics have a chart which demonstrates why the Fed decided to keep M3 under wraps. A look at the chart shows the Fed is pumping up broad money supply at an astounding rate of 11.8% per year! All of this rapid money supply growth is reflected in an increase in equity prices. The stock market needs to rise just to keep pace with all of this newly-created money. As long as the Fed doesn't rock the boat with another rate hike or by turning off the spigot of money flowing into the markets, the equity markets will continue to run.”
Ah-ha! So the Fed gooses the money supply, stocks shoot up, and everyone's happy — right?
Wrong. Growth in the money supply should (closely) parallel growth in the overall economy. So if GDP is shrinking (which it is) and the money supply is increasing then—Viola!—inflation. (“11.8%” to be precise)
Of course inflation doesn't affect the investor class or their fellow-scoundrels at the Fed — the more money floating around the markets the better for them. It's just the opposite for the pensioner on a fixed income or the salaried wage-slave who gets a 15-cent pay raise every millennia. They end up getting ripped off with every newly-minted greenback.
But then that's the plan — to shift zillions from one class to another through massive equity bubbles. All it takes is artificially-low interest rates and a can of WD-40 to keep the printing presses rolling. It's so simple we won't dignify it by calling it a “conspiracy”. It's just a swindle, pure and simple. But it never fails.
Every time the Fed prints up another batch of crisp $100 bills; they're confiscating the hard-earned savings of working class people and retirees. And, since the dollar has dropped roughly 40% since Bush took office in 2000; the government has absconded with 40% our life savings.
That's the truth about inflation; it is taxation without representation, but you won't find that in the government's statistics. In fact, the Consumer Price Index (CPI) deliberately factors out food and energy so the working guy can't see how the Fed is robbing him blind. The only way he can gauge his losses is by going to the grocery store or gas station. That's when he can see for himself that the money he works so hard to earn is steadily losing its purchasing power.
The big question now is how long will it take before foreign creditors wise up and see the maxed-out American consumer is running out of steam. As soon consumer spending slows in the US; foreign investment will dry up and stocks will tumble. China and Japan have already slowed or stopped their purchases of US Treasuries and China has stated that they plan to diversify their $1 trillion in US dollars in the future. This has lowered demand for the dollar and decreased its value in relation to other currencies. (The dollar hit a new low just last week at $1.36 vs. the euro)
A slowdown in consumer spending is the death-knell for the dollar. That's when there'll be a stampede for the exits like we've never seen before—with each of the world's central banks tossing their worthless greenbacks into the jet-stream like New Years' confetti. According to Monday's Washington Post that moment may have already arrived. As the Post's Martin Crutsinger says, “Consumer spending rose at the slowest rate in five months in March while construction activity managed only a tiny gain, weighed down by further weakness in housing”.
The connection between housing and consumer spending is critical. Housing has been the main engine for growth in the US in the last 5 years accounting for 2 out of every 5 new jobs and hundreds of billions in additional spending through home-equity extractions. A downturn in consumer spending means that foreign investors will have to look for more promising markets abroad, which will trigger a steep reduction in the amount of cheap credit coming into the country via the $800 billion trade deficit. This will slow growth in the US while further weakening the dollar.
Can you say stagflation?
The present currency and economic crises were brought on by Bush's unfunded tax cuts, unsustainable trade deficits, and the Fed's hyperinflationary monetary policy. These policies were executed simultaneously for maximum effect. They were entirely premeditated. Many people now believe that the Bush administration and the Federal Reserve are intentionally creating an “Argentina-type meltdown” so they can privatize state owned assets and usher in the North American Union--the future “one state” alliance of Canada, Mexico and US--along with the new regional currency, the Amero.
Stay tuned.
Nevertheless, monetary policy is not the only reason the stock market is headed for a fall. There's also the jumble of scams and swindles which have been legalized under the rubric of “deregulation”. New rules allow Wall Street to take personal liabilities and corporate debt and repackage them as precious gemstones for public auction. It's the biggest racket ever.
Consider the average hedge fund for example. The fund may have originated with $10 billion of its own cash and swelled to $50 billion through (easily acquired) credit. The fund manager then creates an investment portfolio that features CDOs (collateralized debt obligations) and Mortgage Backed Securities (MBS) to the tune of $160 billion. The majority of these “assets” are nothing more than shaky subprime loans from struggling homeowners who have no chance of meeting their payments. In other words, another man's debt is magically transformed into a Wall Street staple. (Imagine if you, dear reader, could sell your $35,000 credit card debt to your drunken brother-in-law as if it was a bar of gold or a vintage Ferrari. That, believe it or not, is the scam on which bond traders thrive)
So, the fund is leveraged, the assets are leveraged and (guess what) the investors are leveraged too — either buying on margin or borrowing oodles of cheap, low interest credit from Japan to maximize their profit potential.
Get the picture; debt x debt x debt = maximum profit and skyrocketing stock prices. That's why the face value of the market's equities far exceeds the world's aggregate GDP. It's all one, big debt-Zeppelin and it's rapidly tumbling towards planet earth.
KABOOM!
Deregulation works like a charm for the gangsters who run the system. After all, why would they want rules? They're not thinking about capital investment, productivity or infrastructure. They're not building an economy that serves the basic needs of society. They're looking for the next big mega-merger where two monolithic, maxed-out corporations join in conjugal bliss and create a mountain of new credit. That's where the real money is.
Wall Street generates boatloads of cyber-cash with every merger. This pushes stock prices up, up and away. Deregulation has turned Wall Street into the biggest credit-generating Cash-Cow of all time—spawning zillions through seemingly limitless debt-expansion. These virtual dollars were never authorized by the Federal Reserve or the US Treasury—they emerge from the black whole of over-leveraged uber-transactions and the magical world of derivatives trading. They are a vital part of Wall Street's house of mirrors where every dollar is increased by a factor of 50 to 1 as soon as it enters the system. Assets are inflated, debt is converted to wealth, and fiscal reality is vaporized into the toxic gas of human greed.
Doug Noland at Prudent Bear.com explains it like this: “We've entered a euphoric phase of financial arbitrage capitalism with extreme Ponzi overtones, a pyramid scheme of revolving credit rackets and percentage spread plays completely abstracted from any reality of fruitful activity. The reason we don't even call "money" by its former name anymore is precisely because we realize at some semi-conscious level that "liquidity" is not really money. Liquidity is a flow of hallucinated surplus wealth. As long as it flows in one direction, into financial markets, valve-keepers along the pipeline, like Goldman Sachs, Citibank, or the hedge funds, can siphon off billions of buckets of liquidity. The trouble will come when the flow stops -- or reverses! That will be the point where we will rediscover that liquidity really is different from money, and if we are really unlucky we'll discover that our money (the US dollar) is actually different from real wealth”.
Noland is right. The market is “a pyramid scheme of revolving credit rackets and percentage spread plays” and no one really knows what to expect the flow of liquidity slows down or “reverses”.
Will the stock market crash?
It depends on the aftereffects of the subprime meltdown. The defaults on existing mortgages are only part of the problem. The real issue is how the “credit dependent” stock market will respond to the tightening of lending standards. As liquidity dries up in the real estate market; all areas of the economy will suffer. (We've already seen a downturn in consumer spending) Wall Street is addicted to cheap credit and it has invented myriad abstruse debt-instruments to get its fix. But what happens when investment simply withers away?
According to WorldNetDaily.com Jerome Corsi that question was partially answered in a letter from the Carlyle Group's managing director William Conway Jr. Conway confirms that the rise in the stock market is related to “the availability of enormous amounts of cheap debt”. He adds that:
“This cheap debt has been available for almost all maturities, most industries, infrastructure, real estate and at all levels of the capital structure.” (But) “This liquidity environment cannot go on forever. The longer it lasts, the worse it will be when it ends…….Of course when ends, the buying opportunity will be once in a lifetime."
Ah, yes; another wonderful “buying opportunity”!?!
You can almost feel the breeze from the great birds flapping overhead as they focus their gaze on the carrion below. Once the stock market collapses and the greenback flattens out on the desert floor; they'll be plenty of smiley faces preparing for the feast.
Conway is right; the stock market IS floating on a cloud of cheap credit created by a humongous trade deficit, artificially low interest rates, and a 10% yearly expansion of the money supply. Like he says, “It cannot go on forever.”
And, we don't expect that it will.
By Mike Whitney
Email: fergiewhitney@msn.com
Saturday, April 21, 2007
Appraisers Pressured to Inflate Values
Daily Real Estate News April 20, 2007
The four biggest trade groups representing appraisers say inflated property valuations have been one of the main driving factors behind the surge in foreclosures by financially strapped borrowers.
Led by the Appraisal Institute, the organizations also argue that inflated appraisals are at the center of many mortgage fraud schemes, and they’ve called on federal regulators to come down harder on lenders that pressure appraisers to boost valuations in order to permit overpriced deals to proceed. In many instances, such lenders failed to require "firewalls" separating loan officers working on commission from appraisers tasked with assigning a value to the property being financed.
In a 2006 poll conducted by October Research Corp., 90 percent of the appraisers reported having been the victims of such forms of coercion as nonpayment of fees and outright threats and many reported having lost business when they opted not to go along with the plan.
Source: Baltimore Sun (04/20/07)
© Copyright 2007 Information Inc.
Deep Impact: Foreclosure Surge in California
Daily Real Estate News April 17, 2007
A surge of foreclosures in California has some economists concerned that the fallout will be long lasting and potentially wound the whole economy.
The 11,033 foreclosures in the first three months of the year represent an 800 percent increase over the same period a year earlier.
"For this rise in foreclosures to be happening in the midst of a strong labor market is truly unique and scary," says analyst Christopher Thornberg of Beacon Economics.
He predicts foreclosures will top out at four or five times the current level — enough, he says, to induce a recession or at least bring the economy to the precipice.
Others are less pessimistic. "The housing sector is in trouble for a considerable period," says Edward Leamer, director of the UCLA Anderson Forecast. "But the rest of the economy will muddle through."
Source: Los Angeles Times, David Streitfeld (04/17/07)
Realtor Magazine Online
http://www.realtor.org/RMODaily.nsf/pages/News2007041706?OpenDocument
FEBRUARY 2007 MARKET REPORT
FEBRUARY 2007 MARKET REPORT
February sales of Conejo Valley single-family homes totaled 93. This compares to 102 sold in January and 109 a year ago, according to Allen Reznick President, Conejo Valley Association of REALTORS.
Median sales price for single-family homes in February 2007 was $809,375; in 2006 it was $814,394. The median price is the point where half of the units sold for more and half for less.
Median prices for single-family homes in February were as follows: $500,000 for 2 two bedroom homes, 690,475 for 29 three-bedroom homes; and $867,424 for 62 four or more bedroom homes. This compares to sales in February 2006 of $625,000 for 3 homes up to two bedrooms; $684,792 for 38 three-bedroom homes; and $928,571 for 68 four or more bedroom homes.
Condominium sales totaled 36 in February compared to 51 in January 2007 and 44 for February 2006
Total Sales for all real estate transactions in February were $122,942,304 for February 2006 the total was $130,361,675.
New residential listings totaled 129 in February 2007 compared to 211 in February 2006 and 180 in January 2007.
Friday, April 20, 2007
MarketWatch: California home prices to weaken further: Goldman
Investment bank Goldman Sachs is increasingly concerned about the health of California's real estate market ...
Mortgage delinquencies jumped 46% in California last year, vs. a 5% increase nationally, Goldman said in a note to clients late Thursday.
Delinquencies on prime and subprime adjustable-rate mortgages in California soared by 78% and 60% respectively, vs. 33% and 24% across the U.S., the bank added, citing recent data from the Mortgage Bankers Association.
Median California home prices are still creeping up, and the state's strong employment trends should support the real estate market. But Goldman is worried that surging prices in the state in recent years weren't driven by traditional factors such as strong employment and income growth. Instead, the bank reckons an increase in ARM mortgages offered to borrowers who were already stretching to buy high-priced homes fueled the boom.
Now that lenders are cutting back some of these types of loans and regulators are beginning to crack down, California home prices could begin falling later this year, especially in high-price cities and towns, Goldman said.
Thursday, April 19, 2007
Foreclosure pace nears decade high
The state's increase could soon pull down home prices and even bring a recession, some economists say.

Nearly 900 Californians a week are losing their homes because they can't afford to pay the mortgage — up from about 100 a week a year ago — providing fresh evidence that the housing market's troubles are nowhere near over.
The surge is raising concerns that home prices will soon suffer as a result. The 11,033 foreclosures in the first three months of the year represent an 800% increase over the same period a year earlier.
In addition, 46,760 homeowners were sent default notices in the first quarter, DataQuick Information Systems reported Monday. A default notice is a warning from a lender to catch up on payments immediately or face eviction.
Foreclosures and default warnings are at their highest points in nearly a decade, the La Jolla-based real estate data tracker said.
So far, the effect on home values has been muted. But as the number of move-outs, evictions and forced sales continue to increase, some economists say they will soon start to push prices down.
First to fall will be the low-income communities where marginal loans proliferated, they say. The trend will spread like a virus to more affluent neighborhoods.
The most pessimistic think a housing bust will wound the economy.
"For this rise in foreclosures to be happening in the midst of a strong labor market is truly unique and scary," said analyst Christopher Thornberg of Beacon Economics.
He predicts foreclosures will top out at four or five times the current level — enough, he says, to either induce a recession or at least bring the economy to the precipice.
Other experts aren't exactly optimistic but believe that the situation is more ambiguous. They say the state's low unemployment rate of 4.8% and generally healthy economy will absorb trouble, up to a point.
"My gut is the correction we are seeing is regional and very spotty," said Patrick Veling, president of Real Data Strategies in Brea.
Generally, the places with the cheapest housing in the state — including the Inland Empire and Central Valley — are faring the worst.
In Riverside and San Bernardino counties, the combined volume of foreclosures rose to 2,369 in the first quarter from 255 in the same period last year. The Central Valley, which includes Sacramento County, jumped to 3,039 from 286.
Another problem spot is San Diego County, where the 1,183 foreclosures is the highest since DataQuick began tracking this information in 1988. The county's market peaked earlier than the rest of the state.
Los Angeles County, the largest housing market in the state, is surprisingly strong. The default rate is almost 60% below the first-quarter 1996 peak, DataQuick said.
Most of the loans going into default now were made at the peak of the housing boom in 2005, when some thought the good times would continue forever and lending standards were lax. Nearly 80% of loans made in the state in May 2005 for the purpose of purchasing houses had adjustable rates, a record high.
Many of these mortgages required the borrowers to put little or no money down, and lenders took their word for whatever income they said they made.
For a moment, everything was fine. Then housing prices stopped going up — meaning that many of these borrowers did not have enough equity or income to refinance to a new loan. Others in foreclosure may be able to afford the payments, but have chosen not to make them because their homes are worth less than they paid.
Foreclosures peaked at 15,418 in the third quarter of 1996, at the tail end of the last big slowdown in the state. They bottomed out at 637 in the second quarter of 2005, as the most recent boom was cresting.
The peak for default warnings was in the first quarter of 1996, with 61,541. The 46,760 warnings reported for the first three months of this year is up 148% from the same period last year.
Compared with the mid-1990s, however, the state's population and housing stock have grown modestly.
The sharp rise in foreclosures has become a political issue, with Congress debating methods of aiding those underwater.
There's little precedent for the current wave of foreclosures. Traditionally, people lose their jobs, and then they lose their houses. In the early '90s, the aerospace industry's collapsetriggered a broad recession.
This time, the foreclosures are happening first — and fast.
"It surprises me, the speed at which all this is evolving," said Edward Leamer, director of the UCLA Anderson Forecast.
He sees plenty to worry about. For instance, the recent tightening of loan standards is, for better or worse, eliminating a lot of the fuel that powered the bottom of the market. Entry-level buyers are priced out, which means existing owners have a harder time selling their homes to move up. Eventually, everyone is vulnerable.
"The housing sector is in trouble for a considerable period," Leamer concluded, "but the rest of the economy will muddle through."
In its March housing report last week, DataQuick reported that the median price for homes sold in Southern California was up 4.6% from March 2006 despite a sharp drop in sales.
Because the houses that aren't selling tend to be the cheaper ones, that automatically pushes up the median. Housing bears say a rising median can mask a sinking market.
Even taking this into account, however, the market appears healthier than one might expect.
Sales in the three lowest segments of the market plunged by about 50% in March from March 2006, according to new DataQuick statistics. Yet the median prices in those categories were, on average, unchanged from a year earlier.
"Prices are going sideways," said Veling of Real Data Strategies.
He wondered whether the mood was worse than the reality, adding that the boom went on so long that people's memories are distorted.
"It's been so long since we've seen a normal market that we've forgotten what it looks like," he said.
http://www.latimes.com/business/la-fi-foreclose17apr17,0,3729854.story?page=2&track=mostemailedlink
Free Home Buying School
Workshop offers information to home buyers
The Area Housing Authority is sponsoring a free Home Buying School workshop, "Why it still makes sense to buy vs. rent," from 6:30 to 7:30 p.m. at the Grant Brimhall/Thousand Oaks Library, 1401 E. Janss Road.
The session will include tax benefits, FICO scores and loan options for first-time buyers available through the state of California.
Many new homebuyers are unaware of state and local programs that help with down payments, closing costs and lowerinterest loans.
http://www.toacorn.com/news/2007/0419/Family/061.html
For information or reservations, call (800) 549-0337, ext. 167.
March sales slower than normal
Housing market continues to slide across Southland
Closed sales were off too, down 24.7 percent to 999, according to La Jolla-based DataQuick Information Systems, which tracks real estate activity across a six-county Southland region.
By contrast, the Southern California median where half the prices are higher and half lower rose 4.6 percent to a record $505,000, but sales were down 32.4 percent to 21,856.
Ventura County's median-price decline was 2 percent worse than San Diego County's 4.9 percent drop, according to DataQuick. The local median home price typically tracks a little behind Orange County, which reported a 0.6 percent increase in March to $629,000.
An economist said March's bleak numbers reflect his prediction last fall that 2007 Ventura County real estate prices will either decline slightly or be no better than flat.
Some real estate brokers said they believe ongoing media coverage of troubles in the subprime lending market is causing would-be buyers to hesitate in hopes prices will fall further. Others said it's still a little early for spring buying activity to kick in.
"This could just be one month. I wouldn't base the trend, this particular thing, on one month," said Mark Schniepp, director of the California Economic Forecast Project in Santa Barbara. "It's down a little bit steeper, but that could have been the mix. Maybe there were more condos sold and that tended to drag the median price down ... Call me next month when the numbers come out and we'll see if we have a trend."
View of the Southland
Southern California's real estate market is sending mixed messages with last month's sales hitting a 10-year low for March while the six-county median topped $500,000 for the first time, DataQuick reported. And the Southland's median price increase was attributed to a downturn in sales of entry-level homes.
March sales were slower than normal in the Conejo Valley, but offers and listing activity turned brisk as April began, said Glen Scalise of Century 21 Rolling Oaks Realty in Thousand Oaks. Media coverage of increasing foreclosures and subprime borrowers who are having trouble making mortgage payments, he said, are causing some buyers to wait in hopes that many more properties will flood the market and force prices to plunge.
"Our inventory has started to climb a little bit just like I suspected, and our pending sales are up just a hair," he said. "I think they would be up proportionately had we not had all this bad news."
Tony Deleo, broker at Main Street Realty in Ventura, said he thinks DataQuick's estimate of a 24.7 percent sales volume decline is too conservative. "My estimate would be 40 percent," Deleo said, "and I believe the median price is off way more than 6.9 percent."
Ventura had 506 active listings Thursday, including 118 that were in escrow, he said, while Oxnard had 1,056 properties listed with only 160 in escrow.
"That's almost a seven-month supply," Deleo said. "I think this will be the year that the market will clearly bear out my prediction that it will retrench itself."
Homes priced at $525,000 or less are selling fairly well, he said, because entry-level buyers are still active locally. But the market for homes priced from about $550,000 to about $1 million is soft. High-end properties are still selling.
"The affluent people who have money, they're going to buy under any circumstances," Deleo said.
Another Realtor said he had no explanation for why Ventura County prices fell more than those in other Southern California counties, but he does not believe the March downturn indicates a trend.
"My perception has been that there is a little bit of a slowness maybe caused by the tax season and maybe the spring buying season hasn't started yet," said Joe Virnig, president of the Ventura County Coastal Association of Realtors.
"The numbers could show a slowdown that was significant 11 months ago. It's just now all being added into it, not really reflective of just last month's activity ... Not that much has happened over the last month for there to be a decline in one month like that."
Monthly mortgages are up
DataQuick reported that 21,856 new and existing homes and condominiums were sold in Los Angeles, Riverside, San Diego, Ventura, San Bernardino and Orange counties last month. That was up 23.6 percent from 17,680 in February, and down 32.4 percent from 32,320 in March 2006.
Last month's sales were the lowest for any March since 1997, when 20,024 homes were sold.
"Both lenders and buyers are being more cautious, the dicey mortgage financing has all but disappeared," Marshall Prentice, DataQuick's president, said in a prepared statement. "It's becoming apparent that a lot of the 2004-05 buying activity was drawing from the future, and that future is now. A lot of demand was pre-met, otherwise these low sales counts would have put more downward pressure on prices by now."
The typical monthly mortgage payment that Southland buyers committed to last month was $2,326, up from $2,303 the previous month and up from $2,297 a year ago, DataQuick said. Adjusted for inflation, current payments are 8.9 percent more than typical payments in the spring of 1989, the peak of the prior real estate cycle.
Conejo Valley Association of Realtors President Allen Reznick said he had not yet seen the Thousand Oaks area's March prices, but the market looks normal to him. If prices were down last month, he said, it probably indicates more condominiums were sold than normal. Entry-level buyers would purchase most of those, and they are not used to the market.
"People have a lot of choices right now," said Reznick, a broker at Aviara Real Estate. "We've had several years of a really brisk market with limited inventory. I'm not so sure that people totally understand how to react to this type of market. It's a transition. It's going to take a little bit of time for people to be able to make those choices that they now have."
Indicators of market distress are moving in different directions, DataQuick said. Financing with adjustable rate mortgages is declining significantly. Foreclosure activity is rising but is still within the normal range. Down payment sizes are stable and flipping rates and non-owner occupied buying activity is down.
http://www.venturacountystar.com/news/2007/apr/13/housing-market-continues-to-slide-across/
Wednesday, April 18, 2007
In the beginning...
Homeowner default notices jump 123%
County foreclosures surge, information service says
California's slow housing market turned down a bleak path during the first quarter as thousands of homeowners fell months behind in their mortgage payments, leading to a surge of default notices.
Lending institutions filed 46,760 defaults, the most in almost 10 years. The news was coupled by a wave of foreclosures statewide.
In Ventura County, notices of default on houses and condominiums jumped to 965 in the first quarter, up 123 percent from 433 in the same period last year, DataQuick Information Systems reported Monday.
The La Jolla-based real estate information service blamed the increase on flat appreciation, slow sales and the terms of teaser-rate mortgages being reset at a higher interest rate.
The number of default notices sent to California homeowners last quarter increased to 46,760 for the January-to-March period, up 148 percent from 18,856 last year. The notices serve as the first step in a lengthy process toward foreclosure.
In recent years while the market was hot, Ventura County homeowners were largely able to avoid foreclosure by selling their homes, paying off their mortgages and still making a profit. That no longer seems to be the case for some people.
There were 203 foreclosures in Ventura County during the first quarter, up from 17 filed over the same period last year, which was considered a "rock bottom level," said DataQuick spokesman Andrew LePage. The year-over-year leap was a drastic 1,094 percent.
'A perfect storm is brewing'
Since 1988, Ventura County's quarterly average has been 124 foreclosures. Foreclosures peaked at 330 during the third quarter of 1996, and hit an all-time low of six in the third quarter of 2004, LePage said.
Statewide, the loss of homes to foreclosure totaled 11,033 during the first quarter, up 81.5 percent from 6,078 for the previous quarter and 802.1 percent from 1,223 for the first quarter last year.
DataQuick reported that many of the loans that went into default last quarter were originated between April 2005 and May 2006, with a median age of 15 months. Adjustable-rate mortgage use for primary purchase home loans peaked at 77.8 percent in May 2005 but has dropped since.
On primary mortgages, homeowners were a median five months behind on their payments when the lenders started the default processes. The borrowers owed a median $10,784 on a median $331,200 mortgage.
Mortgage broker Mike Anderson is seeing a noticeable increase in foreclosures and is forecasting a major jump soon.
"A perfect storm is brewing, and most people don't even know it," said Anderson, a partner of Ventura County Home Loans in Ventura. "A lot of people are on the cusp of looking at foreclosure."
Some borrowers might not be fully informed or aware of their types of loans, one of which could be an adjustable rate mortgage that is about to increase.
A very different climate
What's driving the increase of foreclosures? Some experts say they don't know. Anderson says the changing of subprime guidelines and the terms of many adjustable rate mortgages increasing are some of the factors.
"More than likely, a large portion of these are going to be foreclosed on. That's when there's going to be blood on the streets, hypothetically," Anderson said. "As early as six months ago, you could do 100 percent financing for the stated borrower with a 600 credit (FICO) score."
It's a different story today. With subprime banks defaulting on these payments and sometimes filing bankruptcy, lenders are cautiously requiring a minimum credit score of 670, and a down payment on the property. This makes it nearly impossible to refinance for a homeowner whose property lost value, and now has more to pay the bank than what was originally owed.
"The market is having a long overdue correction in terms of saying yes to loans," Anderson said.
Many worry the current housing cycle will replicate the housing market's crash in the 1990s, but it's a very different climate, said Bill Watkins, director of the UC Santa Barbara Economic Forecast Project.
"Right now, the economy is doing rather well," Watkins said. "The people who are losing their homes are not typically people who have lost their jobs, but because they've had to deal with the structure of the loan" and don't have enough equity to sell or refinance.
For some, the best option could be to sell, but if the homeowner does not have any equity or savings, the most rational and easy choice could be to simply walk away, and let the house go to the bank, Watkins said.
Buyers hoping to get a good deal on foreclosed homes will likely be disappointed. Home values have not yet been effected by rising defaults, Watkins said.
'Still a lot of demand'
Mark Asai, a real estate foreclosure consultant at Century 21 Rolling Oaks in Thousand Oaks, said a buyer might save from 3 percent to 5 percent off a foreclosed home, but that's it.
"The quantity of foreclosures are very small, and we're in a more affluent area where there's still a lot of demand and not much housing relative to people who want to buy a home," Asai said.
In response to the rising default notices in Ventura County, this month Troop Real Estate Inc. formed Troop Solutions, a subsidiary corporation to assist homeowners who are approaching or are in preforeclosure. Preforeclosure is the period of time before a property goes to public sale.
"What we try to do is identify the rights and obligations of the homeowners and develop strategies and solutions that help them keep their property," said Paul E. Stansen, real estate broker and attorney leading the efforts at Troop Solutions. "In a nutshell, we work to protect homeowners' equity and credit."
He has a large and growing list of potential clients. Receiving counseling isn't cheap. Stansen charges $250 an hour while he sifts through loan documents with a client and tries to find a possible solution, such as a mortgage modification, which might mean extending the term of the loan.
It typically takes from two to three hours to get through the conversation and analyze a 200- to 300-page loan document.
"What we're trying to find out is what's unique about their loan, if there's a prepayment penalty, if there's a rate adjustment, and what they can do to rectify that," Stansen said.
http://www.venturacountystar.com/news/2007/apr/17/homeowner-default-notices-jump-123/
Subscribe to:
Posts (Atom)